Millions of travelers, one story
With 2.5 billion travelers annually, Avolta is the world’s leading travel retailer, operating at over 1,000 locations in 70 countries. A company of this size communicates with many stakeholders simultaneously: investors and analysts, airport operators and concessionaires, brand partners, and employees. The annual report weaves together financial metrics, strategy, and sustainability performance into a narrative that remains relevant to each of these groups.
Data as a common thread
2.5 billion travelers begin their journey at an Avolta store or restaurant, with over 16 million of them being Club Avolta members. This scale gives rise to the report’s central theme: “Big Data.” It runs from the cover image through the photo spreads to the chapters on strategy, illustrating how Avolta uses passenger flows to inform concrete decisions.
Four sections of the report, one navigation bar
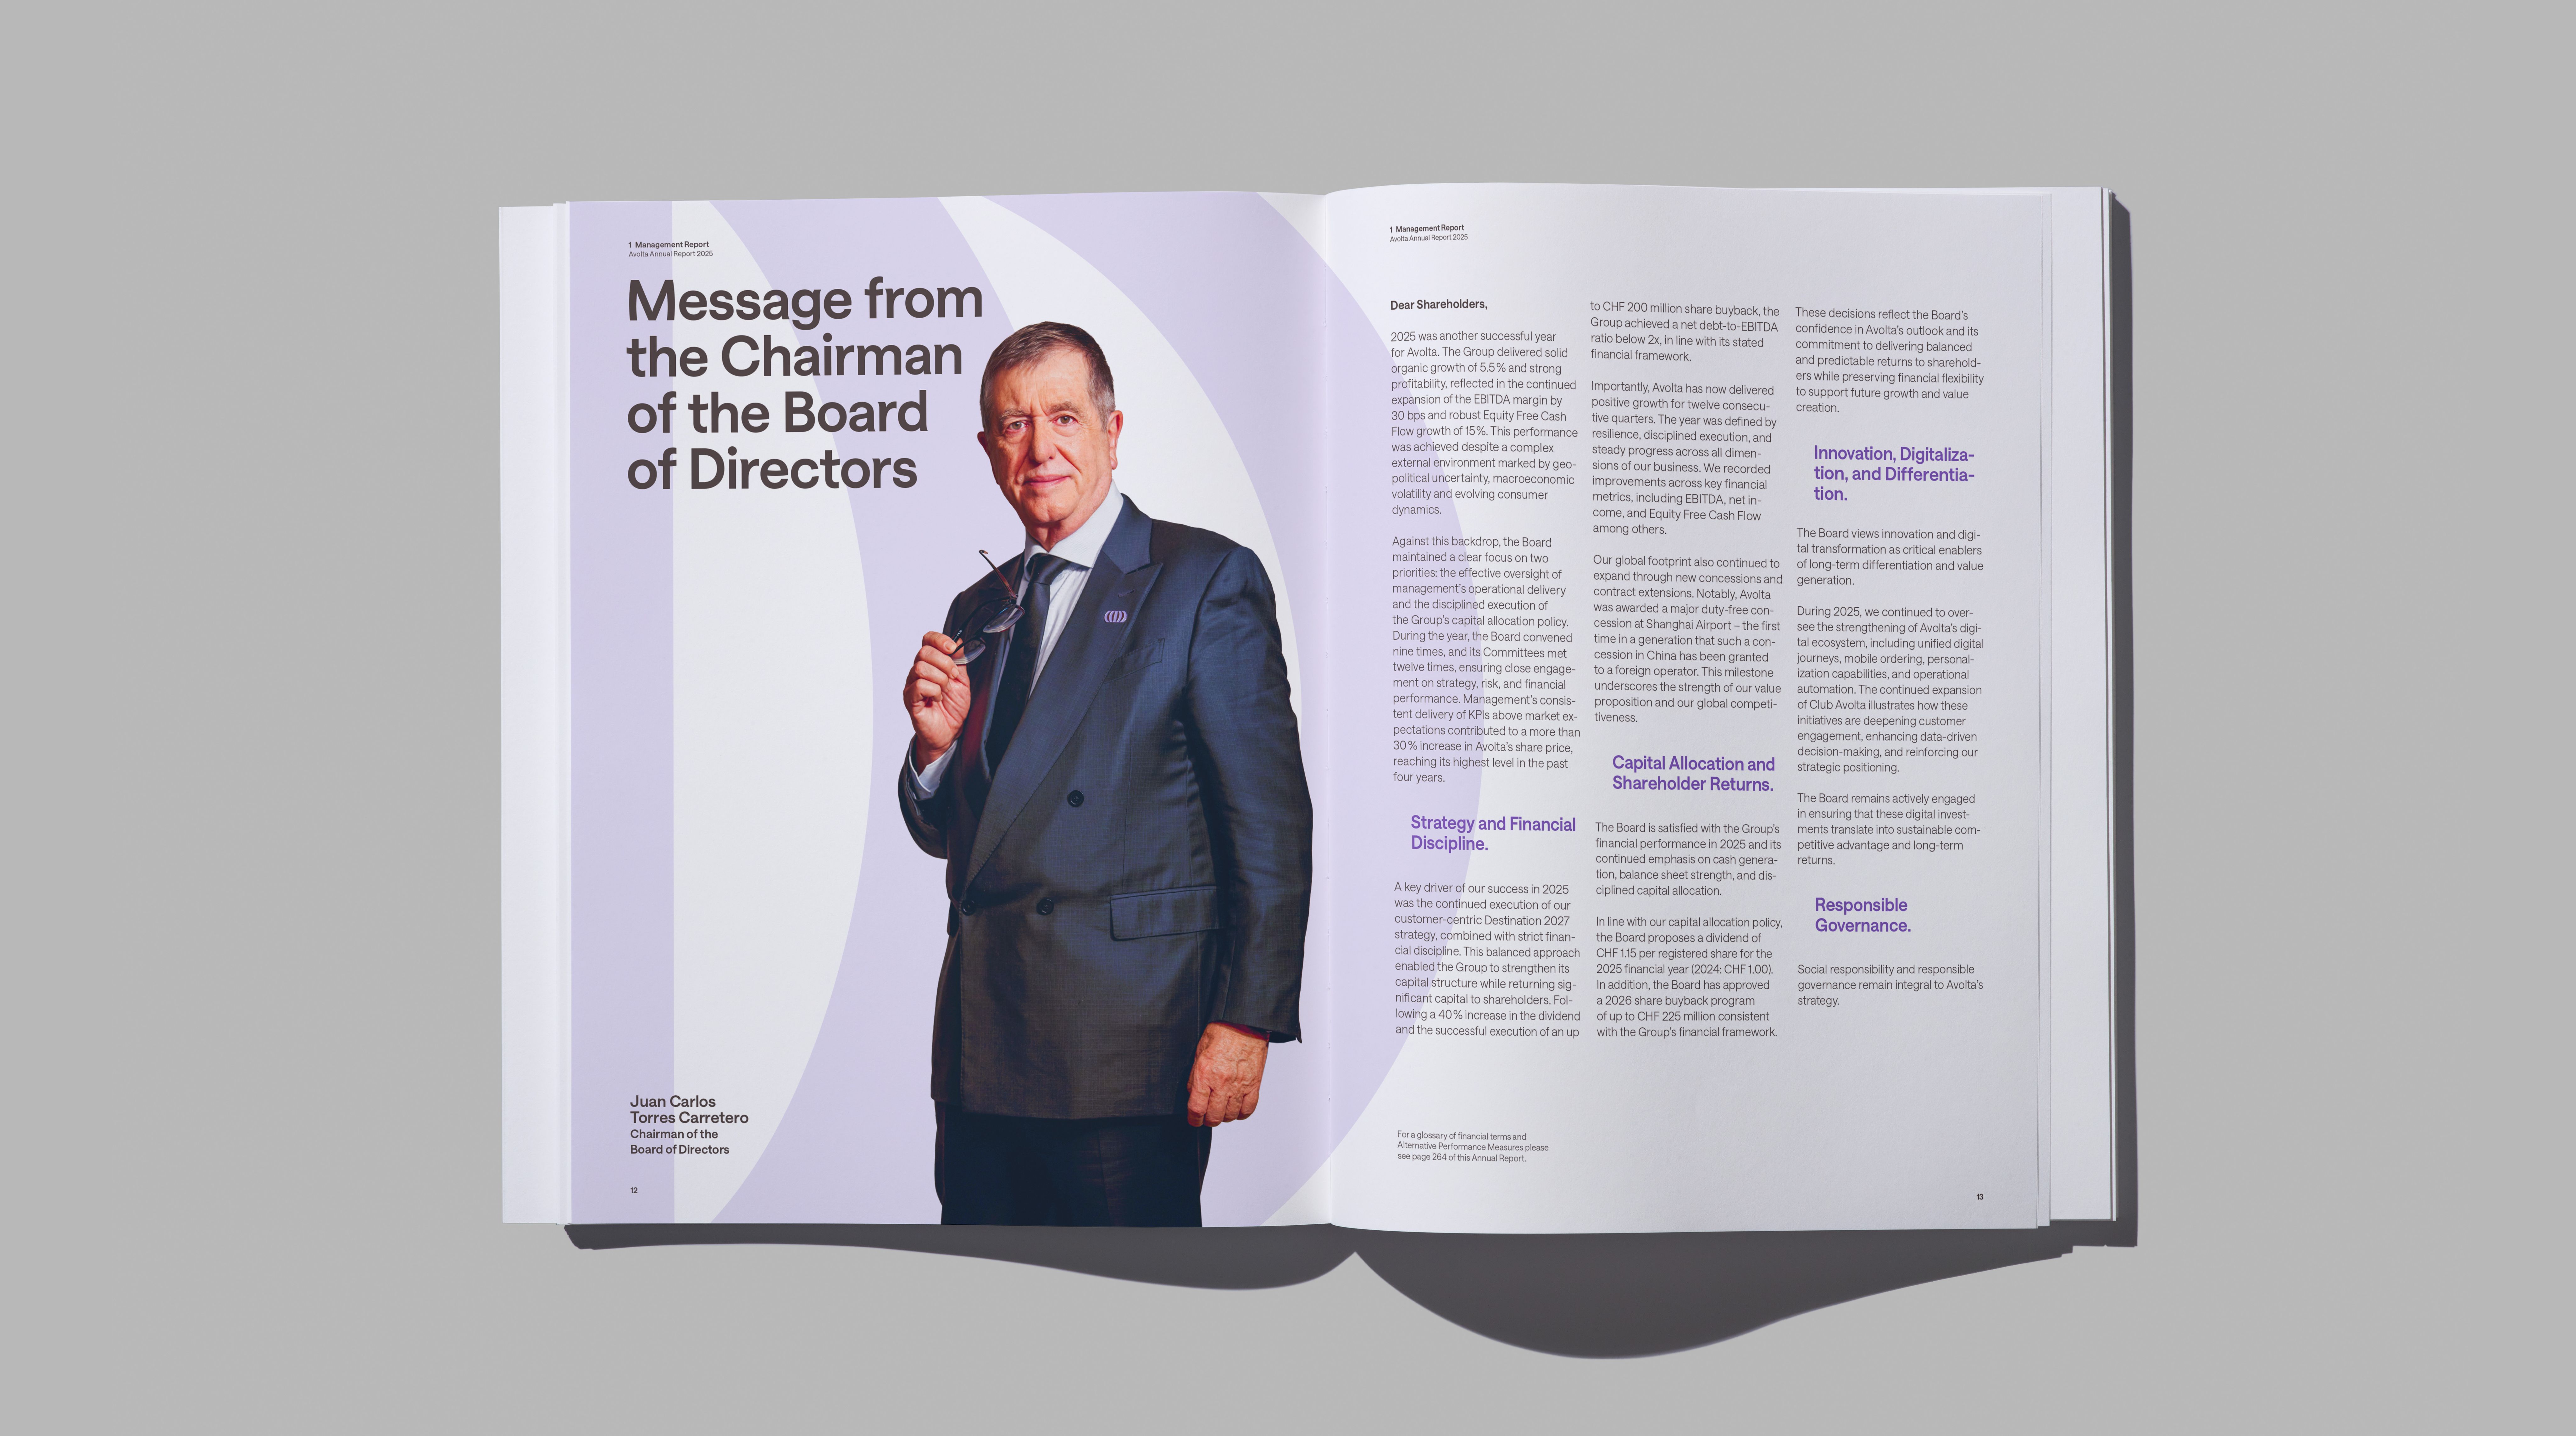
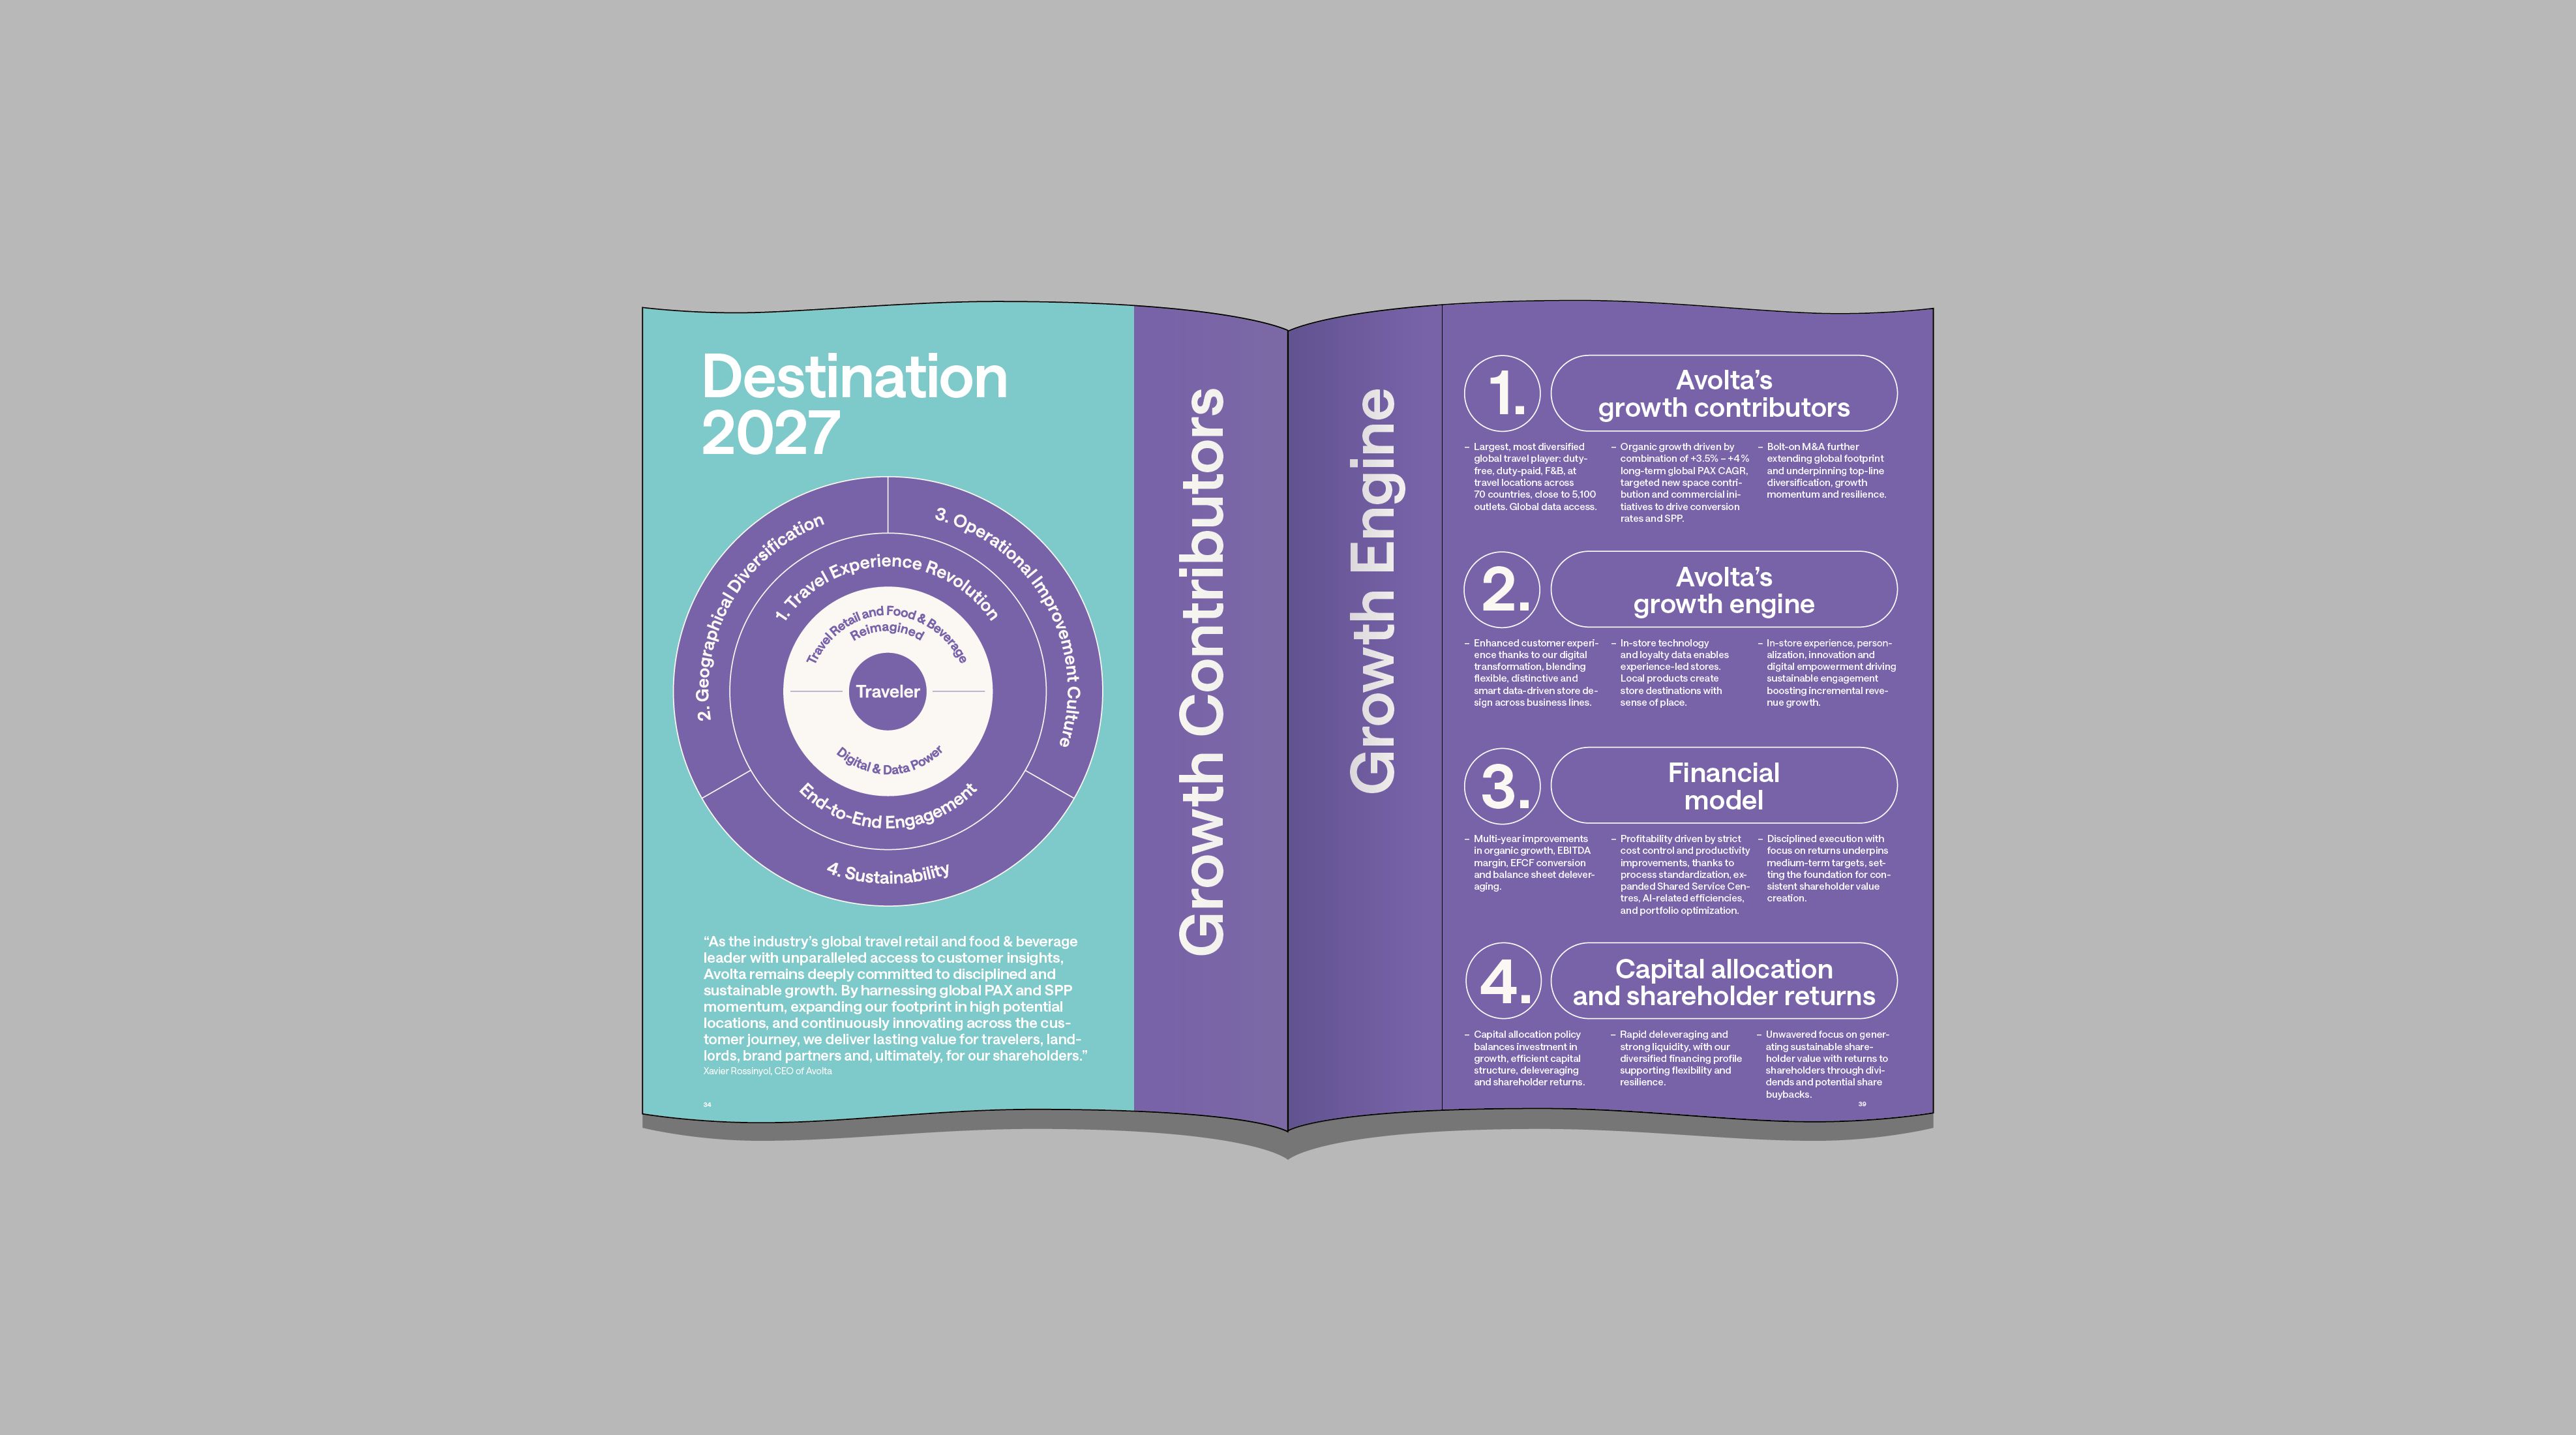
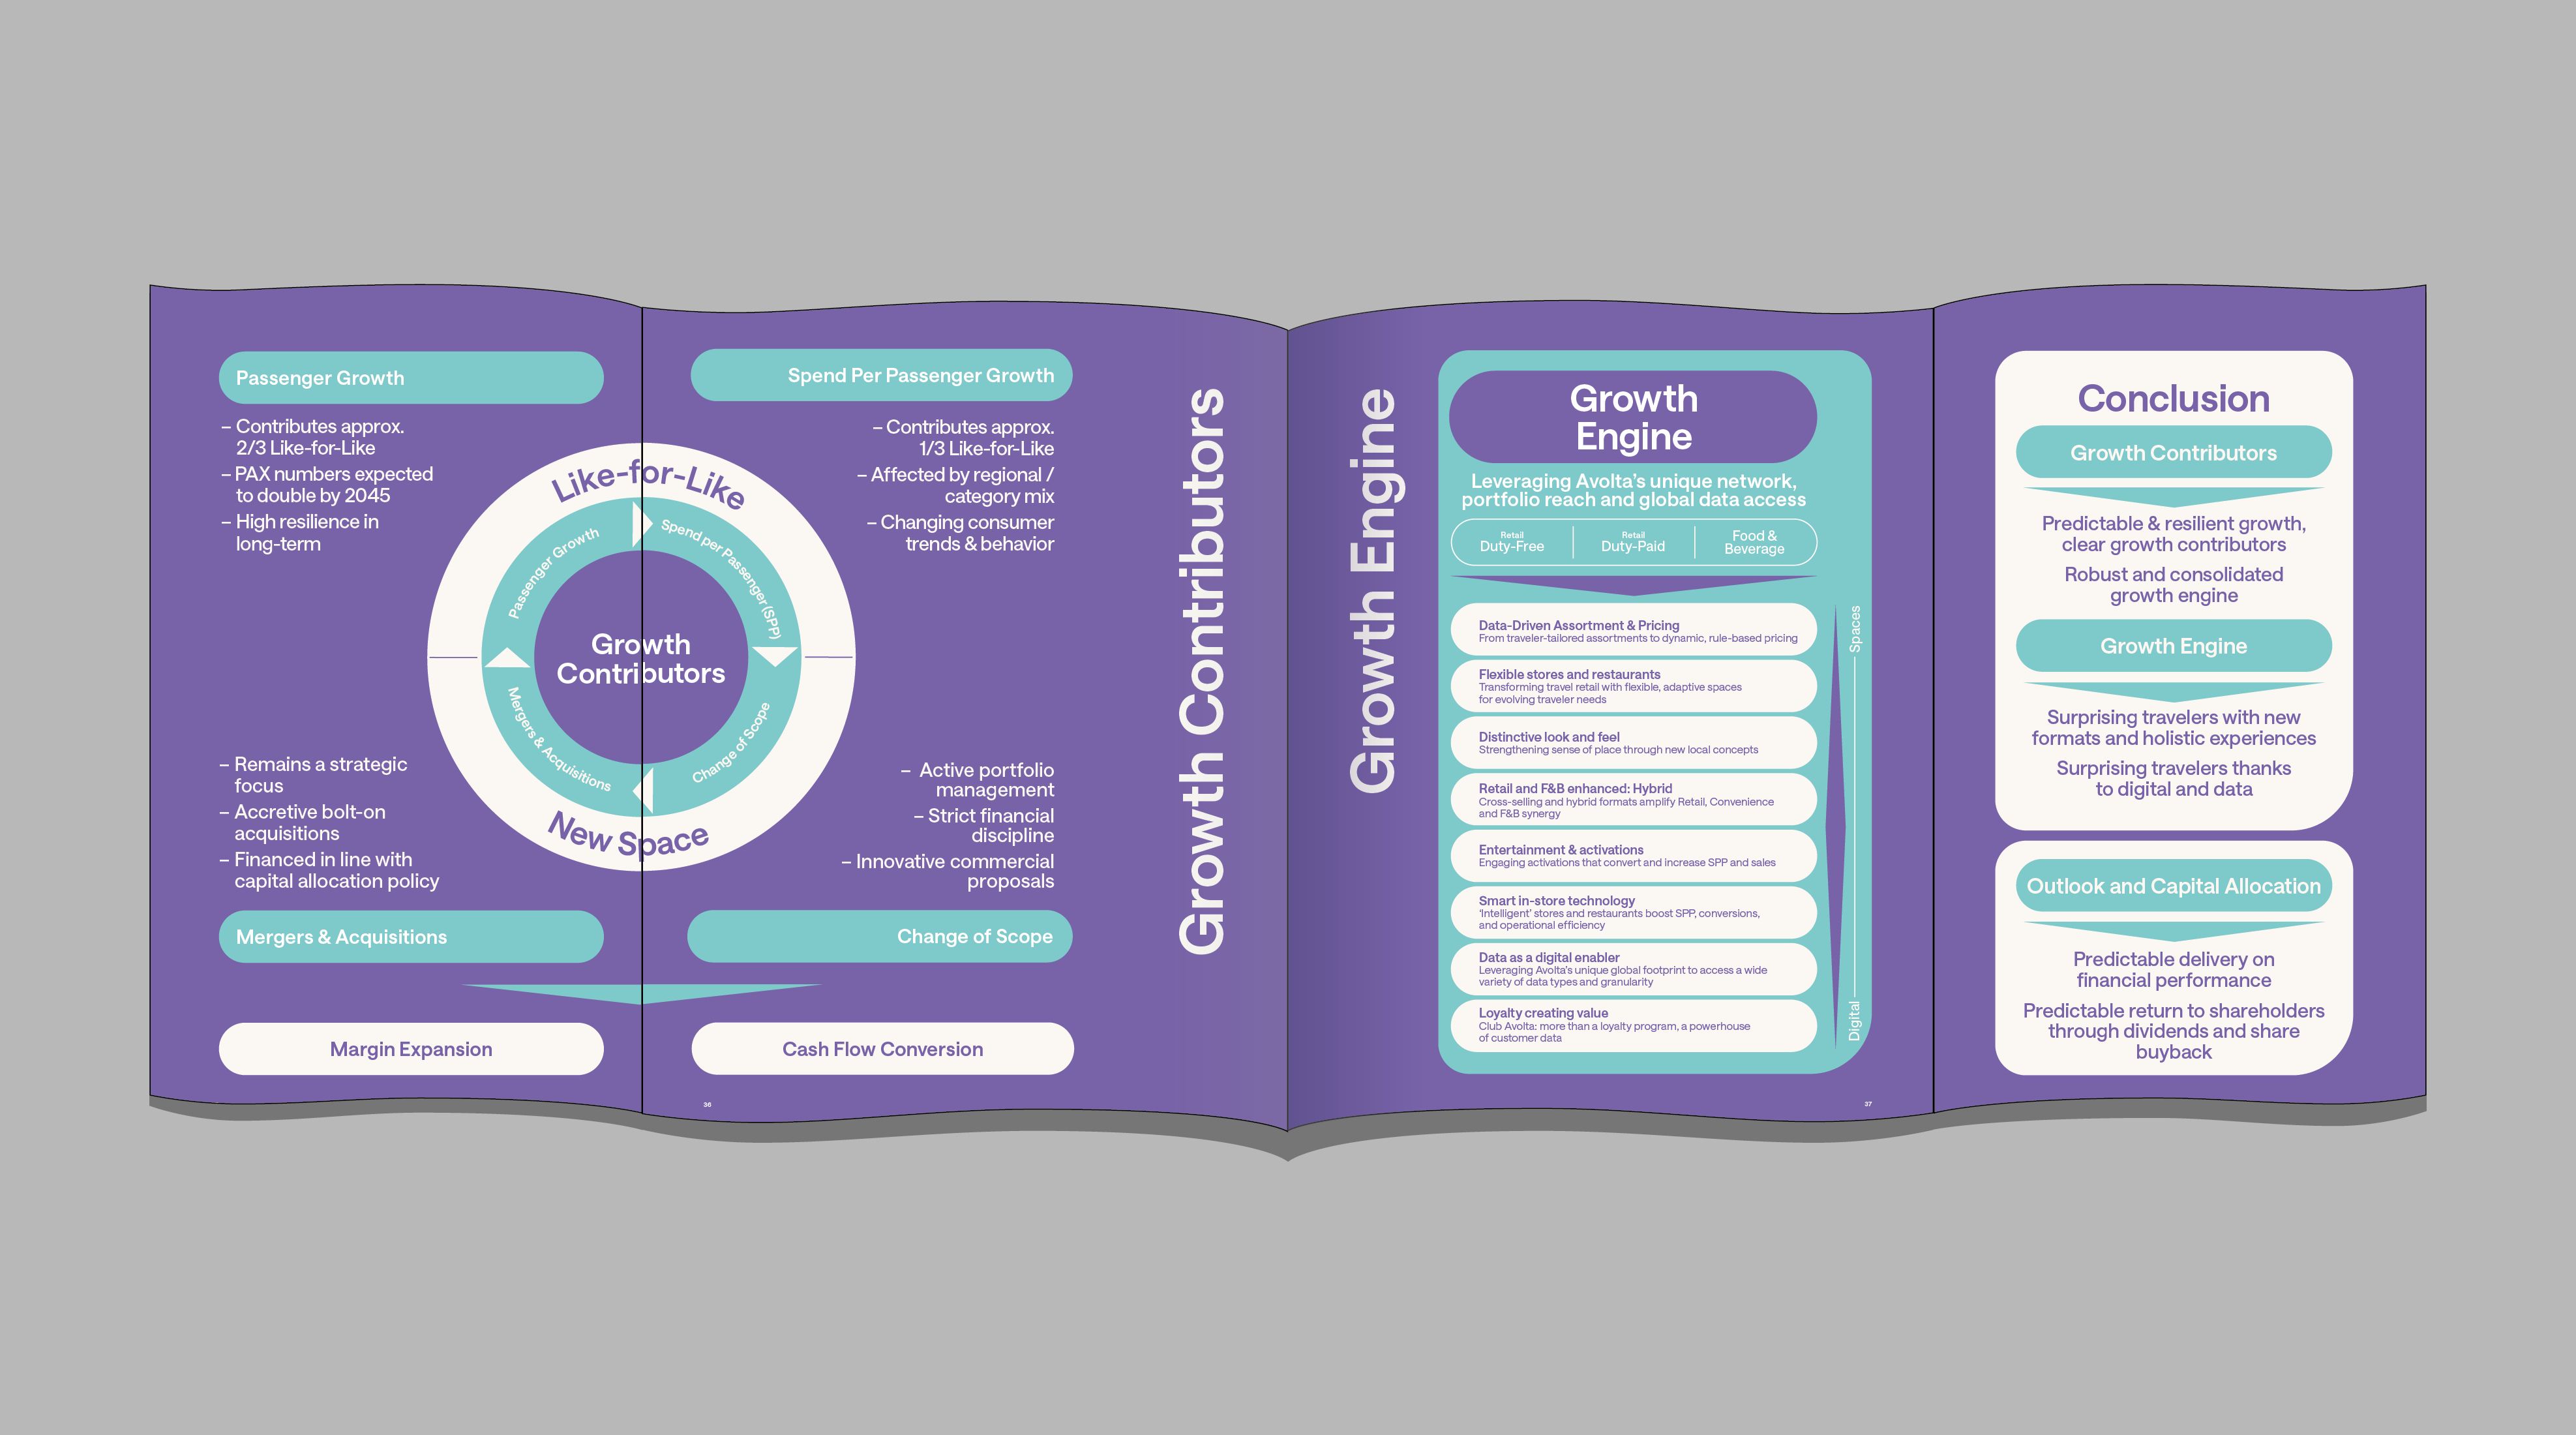
Spanning over 400 pages, the report combines the Management Report, Sustainability Report, Financial Report, and Governance Report. A navigation bar at the top of each page consistently indicates which section readers are currently viewing. The Management Report covers a wide range of topics, from “Avolta at a Glance” and the highlights to the statements from the Chairman and CEO, as well as the “Destination 2027” strategy and the regions. The Sustainability Report covers four key areas: sustainable travel experiences, the environment, employees, and local engagement. The Financial and Governance Report concludes with the CFO’s report, consolidated financial statements, corporate governance, and the compensation report.
Design that makes dimension tangible
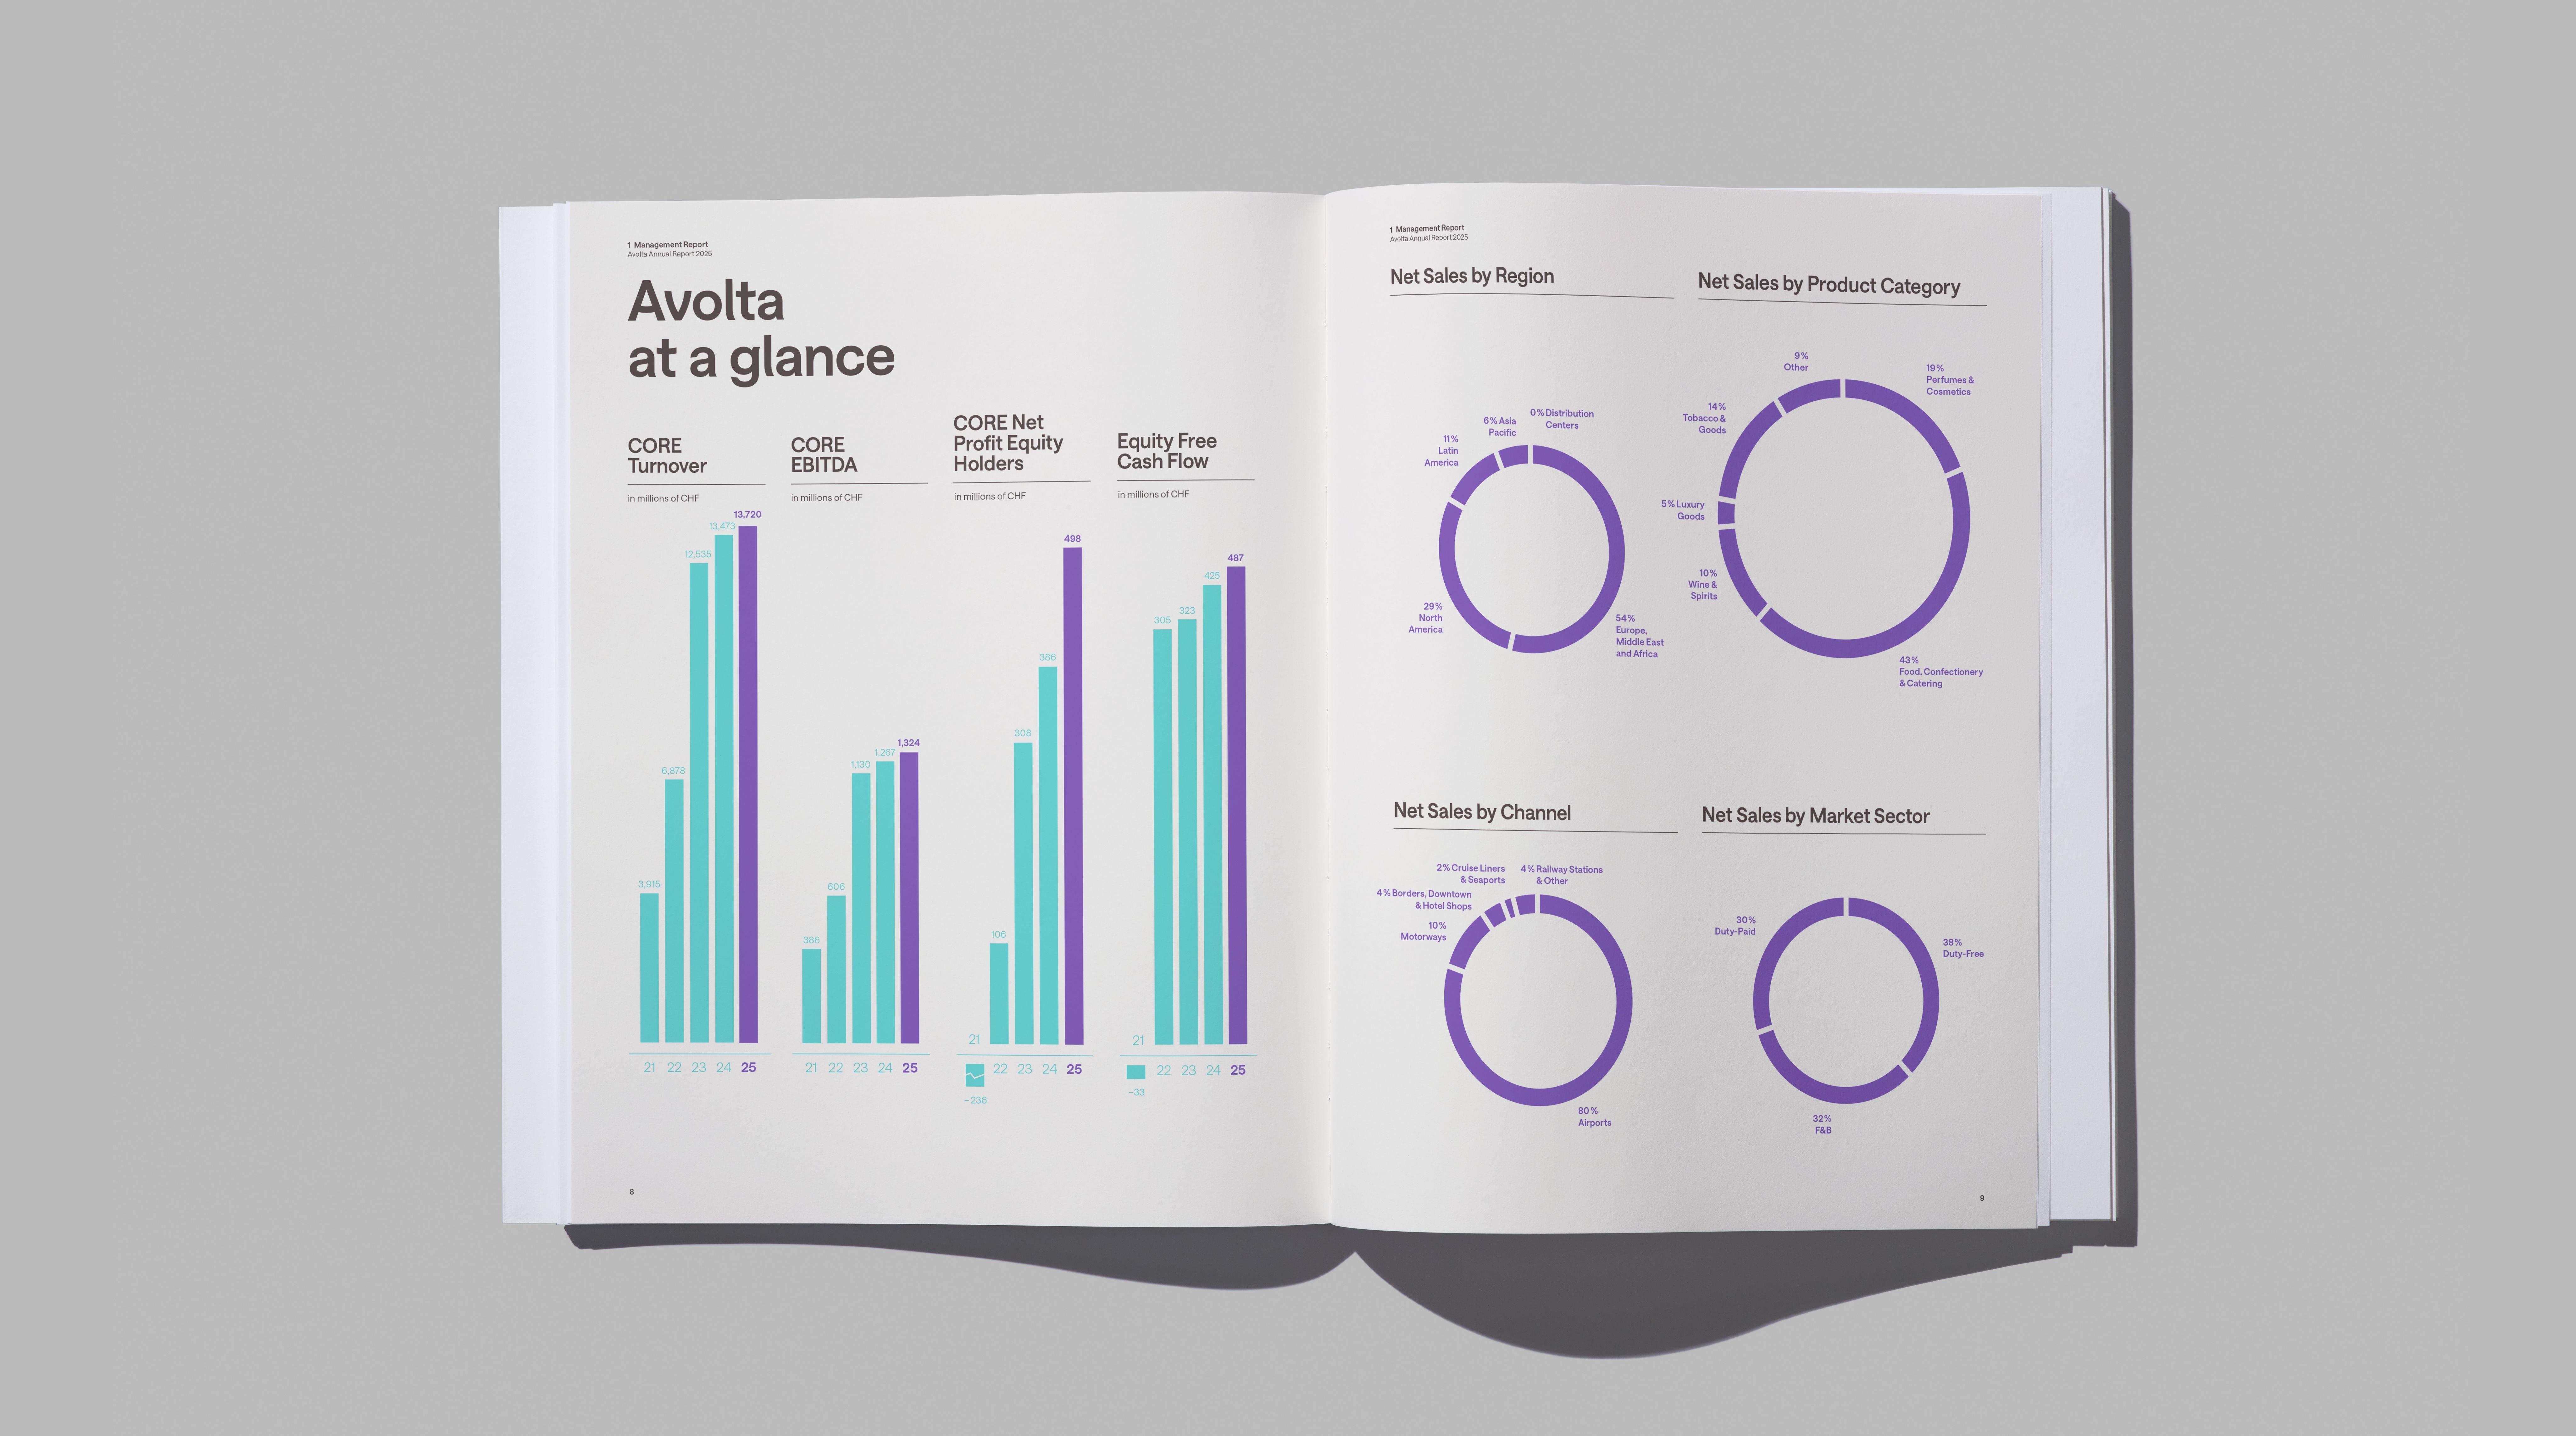
The design concept relies on a clear contrast: large-format documentary photography of airports and stores on one hand, and a minimalist typographic layout in violet and mint green on the other. Divider pages combine airport codes and concept names to create a unique visual identity for each chapter, turning the journey through the report into a journey through Avolta’s network. Key figures are presented using a consistent visualization approach over a five-year period, showing revenue distribution by region, channel, product category, and market segment within a unified graphical system.
The Poster: Key Figures at a Glance
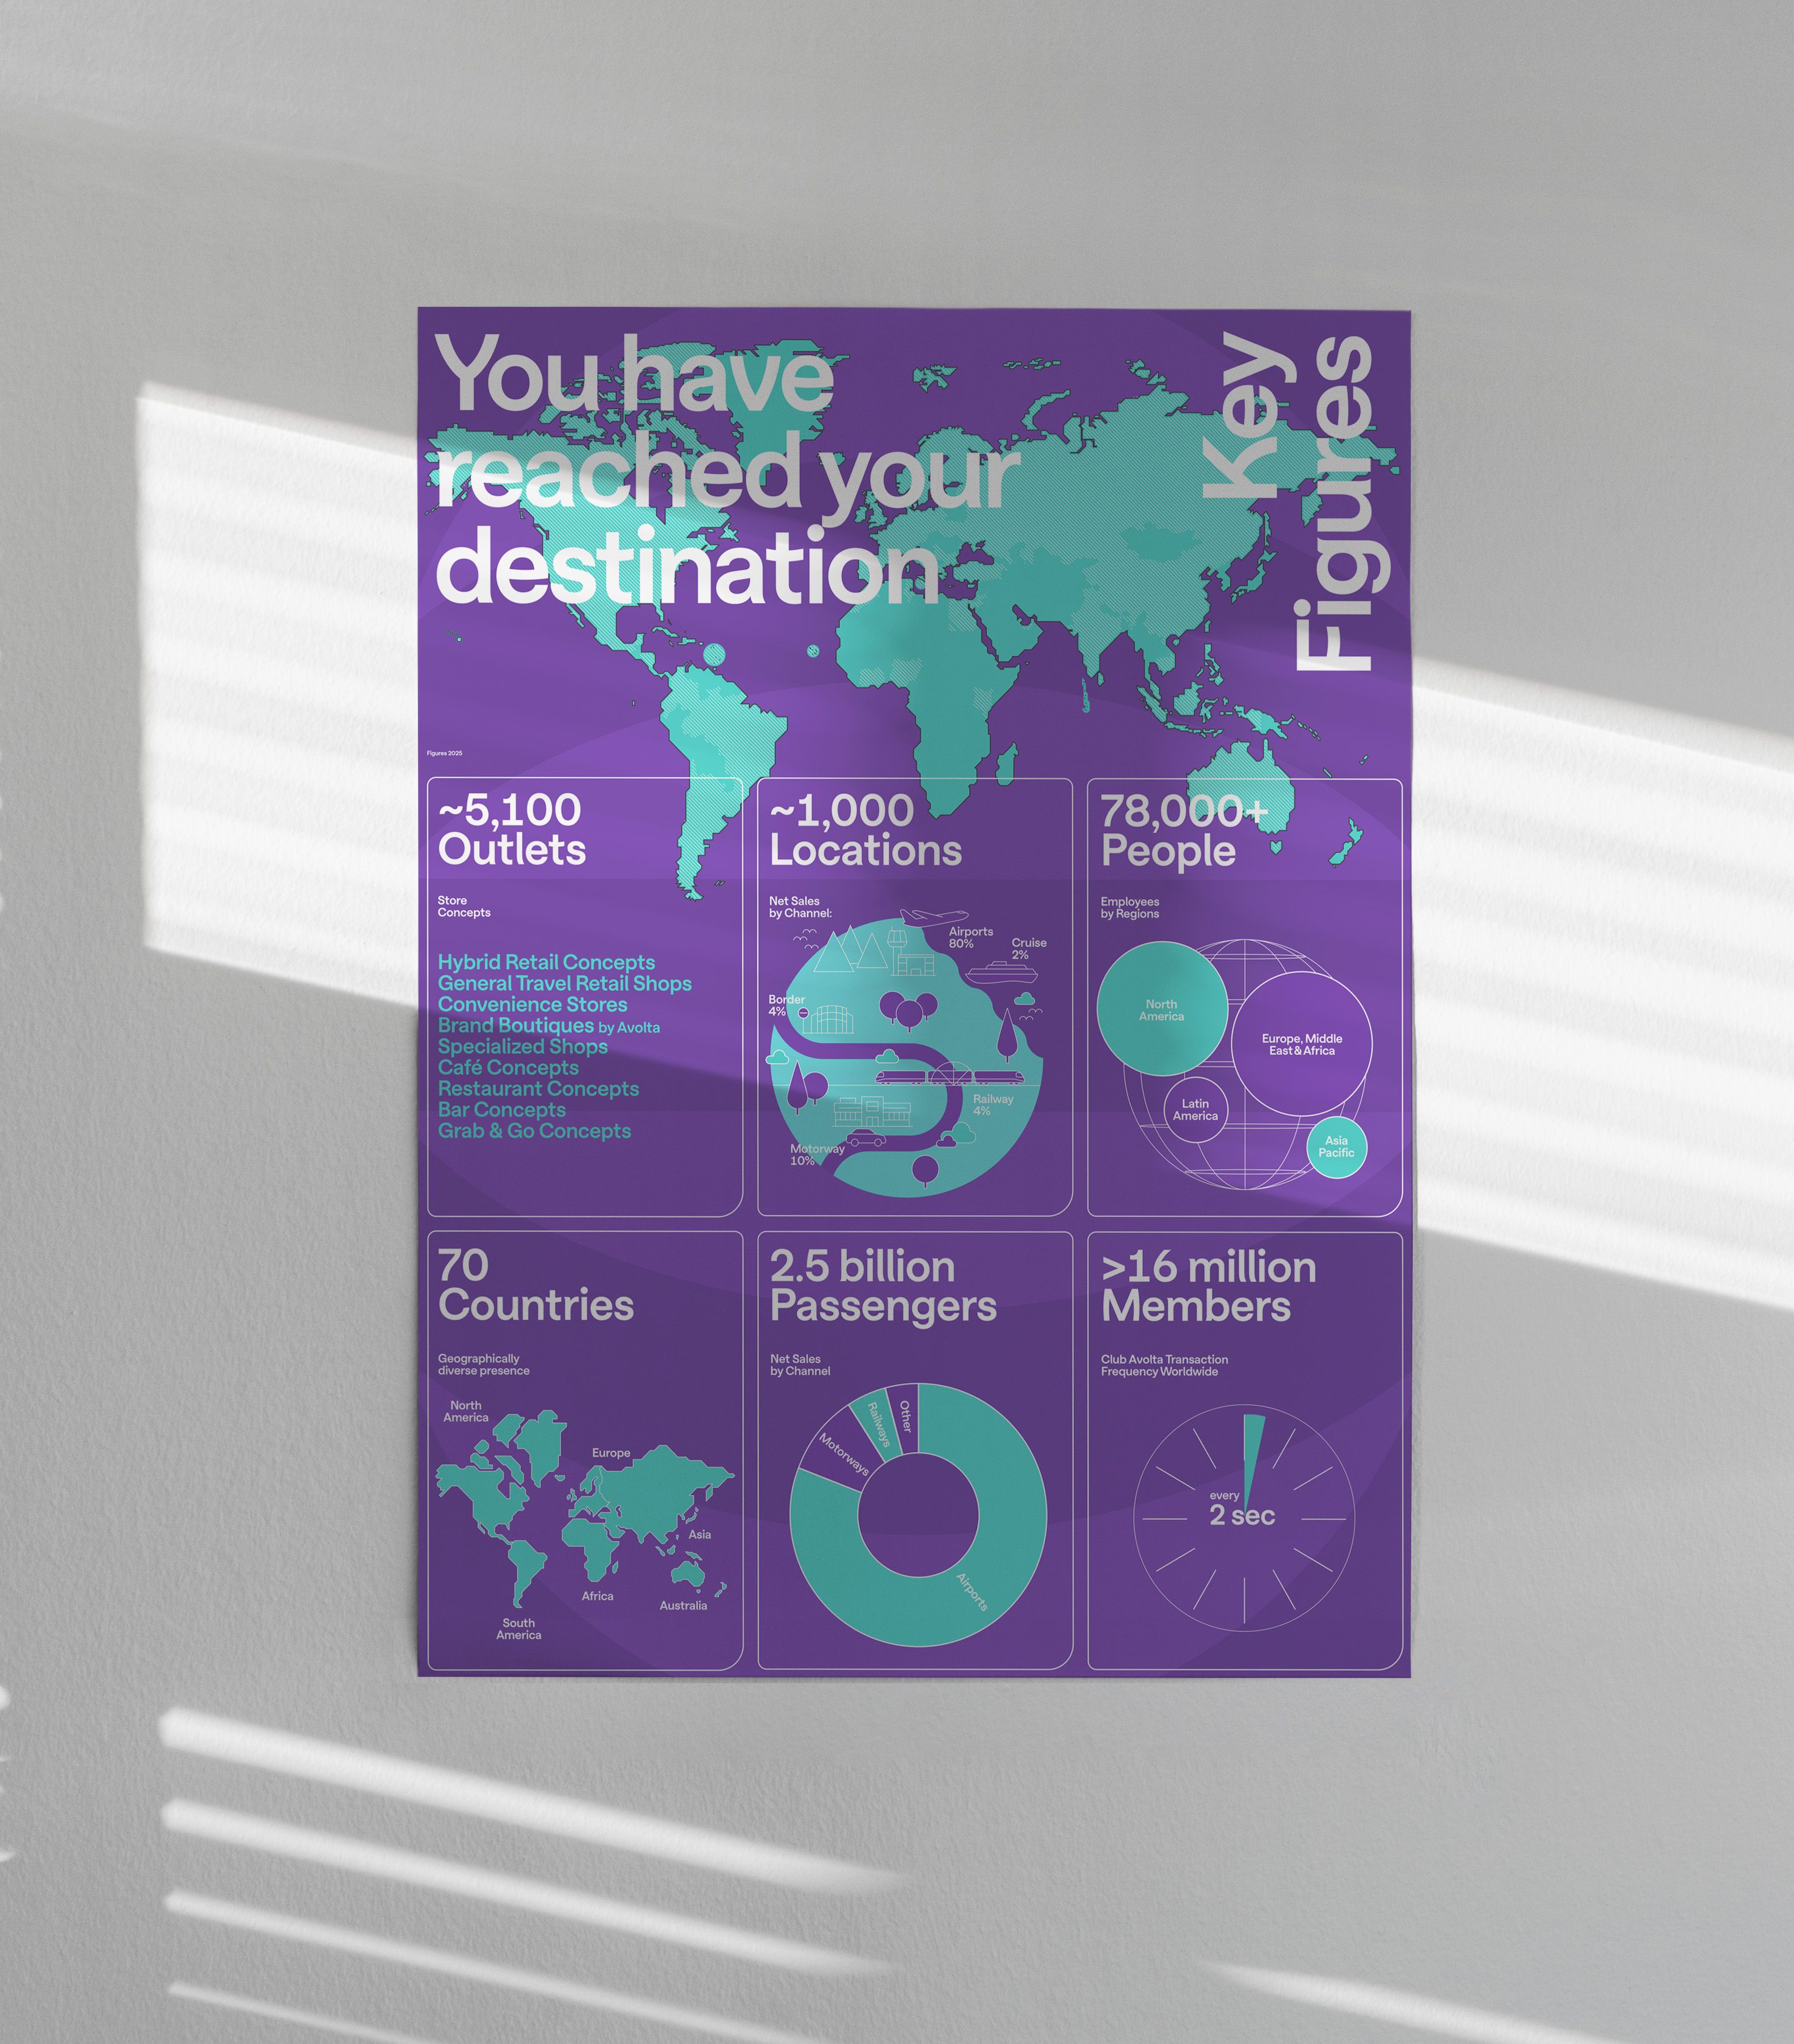
The accompanying poster summarizes the reporting year on two pages. “You have reached your destination” brings together the key figures on a world map: approximately 5,100 outlets, approximately 1,000 locations, 70 countries, over 78,000 employees, 2.5 billion passengers, and over 16 million club members - each figure accompanied by its own infographic. Under the heading “The Power of Data” the back cover traces the data from 9.5 billion passengers in global air travel, through the 2.5 billion in the Avolta network, to the 16 million club members, illustrating how the granularity of the data increases at each level.
Print and Online from a Single Source
The online report translates the report’s structure into a digital navigation system. The chapters appear as a stack of cards that readers can browse through to choose where to start. Key metrics are presented as animated graphics, dynamic content complements the management’s statements, and the layout remains fully functional across all devices, from desktops to smartphones.
Nuovia's Scope of Services
- Content and Design Concept for the Annual Report and Online Report
- Editorial Collaboration
- Design
- Production, including print supervision
More
Insights

Merging three banks into one without losing anyone

Sustainably produced steel with validated climate targets

A report that guides the strategy rather than merely illustrating it

Sustainability in Seven Languages

Their strategy is in place. Does anyone actually understand it?

How climate risk in the timber industry is becoming a driver of growth